High-yield fund inflows paint mixed demand picture
3 min read
Municipal bonds saw a touch of weakness in spots as the last large issues of the week priced while municipal bond mutual fund flows show retail engaged and high-yield continuing to outperform the broader investment-grade market.
U.S. Treasuries faced some pressure on a slew of economic data and Fed speak that gave participants pause on inflation expectations and potential rate cut timing once again. Equities closed the session in the red.
Triple-A yields rose one to two basis points while Treasury yields were higher by up to six basis points on the short end at the close.
The two-year muni-to-Treasury ratio Thursday was at 65%, the three-year at 64%, the five-year at 63%, the 10-year at 63% and the 30-year at 83%, according to Refinitiv Municipal Market Data’s 3 p.m. EST read. ICE Data Services had the two-year at 64%, the three-year at 63%, the five-year at 62%, the 10-year at 62% and the 30-year at 81% at 3:30 p.m
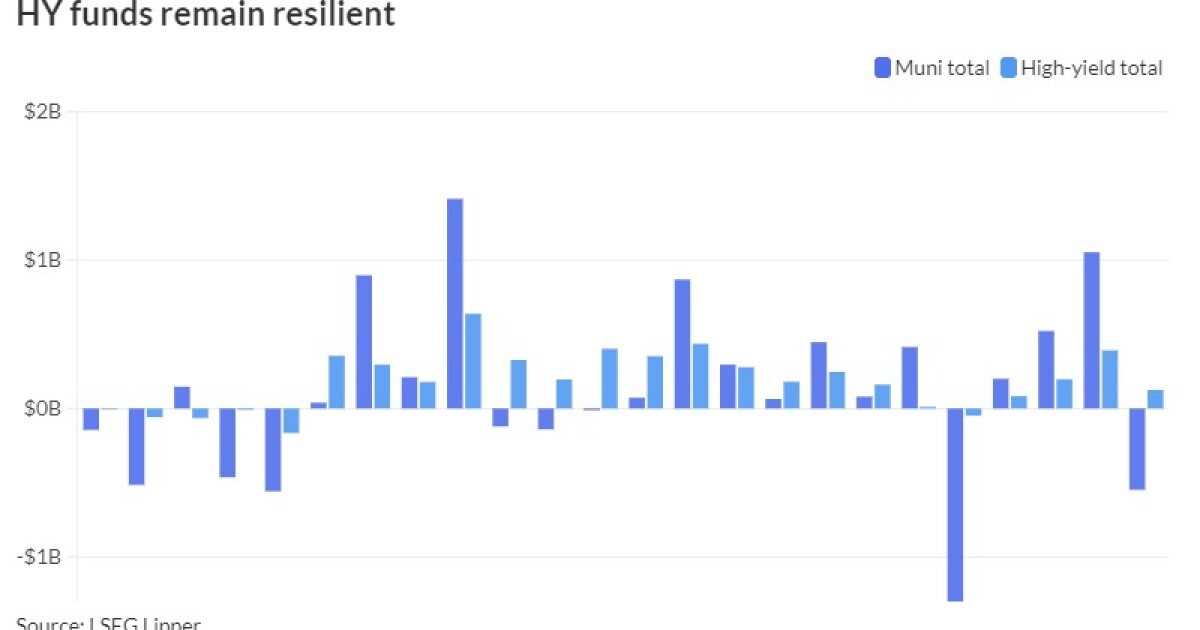
Municipal bond mutual funds saw outflows of $548 million, per LSEG Lipper data, while high-yield saw inflows of $125 million, as
“In terms of credit quality, high-yield funds proved resilient” while investment-grade funds saw outflows of $673 million, noted J.P. Morgan’s Peter DeGroot in a market note.
The data showed weekly municipal fund outflows for the week ending Wedneday, “driven entirely by open-end funds, which were partially offset by exchange-traded fund inflows (+$91 million),” he wrote.
ETFs
While municipals were slightly weaker Thursday, the market’s underperformance of the UST rally Wednesday came “as no surprise” in light of the level of issuance and “given where relative values currently sit,” said Kim Olsan, senior vice president at FHN Financial.
Bond Buyer 30-day visible supply sits at $16.55 billion.
“Any supply value above $15 billion begins to signal a range of credits is being made available, and presently that is occurring with ratios holding in the low- to mid-60% range in the first 10 years on the curve,” Olsan said.
In fact, she said, “mainstream credit spreads continue to widen, especially where the curve is flattest and yields are the skimpiest in the 5-9 year range.”
“One dynamic that has enhanced value is wider credit spreads given the surge in the calendar — effectively putting a wide swath of the market on sale,” Olsan said. The number of deals in lower-rated names has been “dwarfed by higher-grade names.”
This has led to the high-yield outperformance the market is witnessing. Olsan noted that secondary flows “are proving reactive to new-issue activity.”
Wide spreads are apparent across the credit spectrum, as “in-demand New York credits are pricing with attractive levels,” she said, noting, final yields in New York City’s Aa1/AAA Transitional Finance Authority issue netted a 5% due 2036 at 3.10%, or a taxable equivalent yield of over 6% and a $179 million 5.25% coupon due 2041 priced at 3.95%, a TEY near 8%.
“MSRB data point to customer-buy volume on a rolled up basis is just 53% of the total vs 60% over the last 30 days,” she said. “In the 0-1 year and 3-7 year buckets, dealers are actually buying more bonds from customers than selling to them” and between 2025 and 2027 and past 2036, “57% of all flows are customer buys — speaking to where allocations are being treated the best on an absolute yield basis.”
AAA scales
Refinitiv MMD’s scale saw small cuts: The one-year was at 3.21% (unch) and 3.07% (unch) in two years. The five-year was at 2.76% (+2), the 10-year at 2.75% (+2) and the 30-year at 3.76% (unch) at 3 p.m.
The ICE AAA yield curve was little changed: 3.22% (unch) in 2025 and 3.07% (unch) in 2026. The five-year was at 2.77% (+1), the 10-year was at 2.73% (+1) and the 30-year was at 3.73% (unch) at 3:30 p.m.
The S&P Global Market Intelligence municipal curve was little changed: The one-year was at 3.25% in 2025 and 3.07% (unch) in 2026. The five-year was at 2.75% (+2), the 10-year was at 2.75% (+2) and the 30-year yield was at 3.74% (unch), according to a 4 p.m. read.
Bloomberg BVAL was little changed: 3.29% (unch) in 2025 and 3.08% (unch) in 2026. The five-year at 2.67% (+1), the 10-year at 2.64% (+1) and the 30-year at 3.78% (unch) at 4 p.m.
Treasuries were weaker.
The two-year UST was yielding 4.795% (+6), the three-year was at 4.578% (+6), the five-year at 4.403% (+5), the 10-year at 4.381% (+3), the 20-year at 4.622% (+1) and the 30-year at 4.521% (flat) near the close.


