Municipals close tumultuous week steadier, but damage done to returns
4 min read
Municipals saw a stronger tone after U.S. Treasuries improved on a slightly lower-than-expected inflation print while equities made gains to close out a volatile week.
“This month’s inflation print is quite benign, but does it even matter? The bottom-line is another one or two months of benign inflation prints will not change the hawkish monetary policy pivot that was introduced on Wednesday,” said Olu Sonola, Fitch Ratings head of U.S. economic research. “The Fed is now likely to wait to see how tariff and immigration policy unfolds over the next coming months before we see another rate cut.”
UST yields fell by two to five to close the session while municipals were better by a basis point or two out long.
“Such an abrupt change in the Fed’s posture demanded a repricing in the macro rates market and caused a strong bear flattening of the Treasury curve on Wednesday,” noted BofA Global Research strategists led by Yingchen Li and Ian Rogow. “Our muni rates view may be subject to Treasury rates risks due to low muni/Treasury ratios. Investors should take a defensive posture and wait for the Treasury rates market to settle.”
Investors should keep an “open mind regarding the path of bond market moves,” they said, adding that they may need to put on some hedges “to protect the post-election gains if the 10-year Treasury yield stays above 4.50%.”
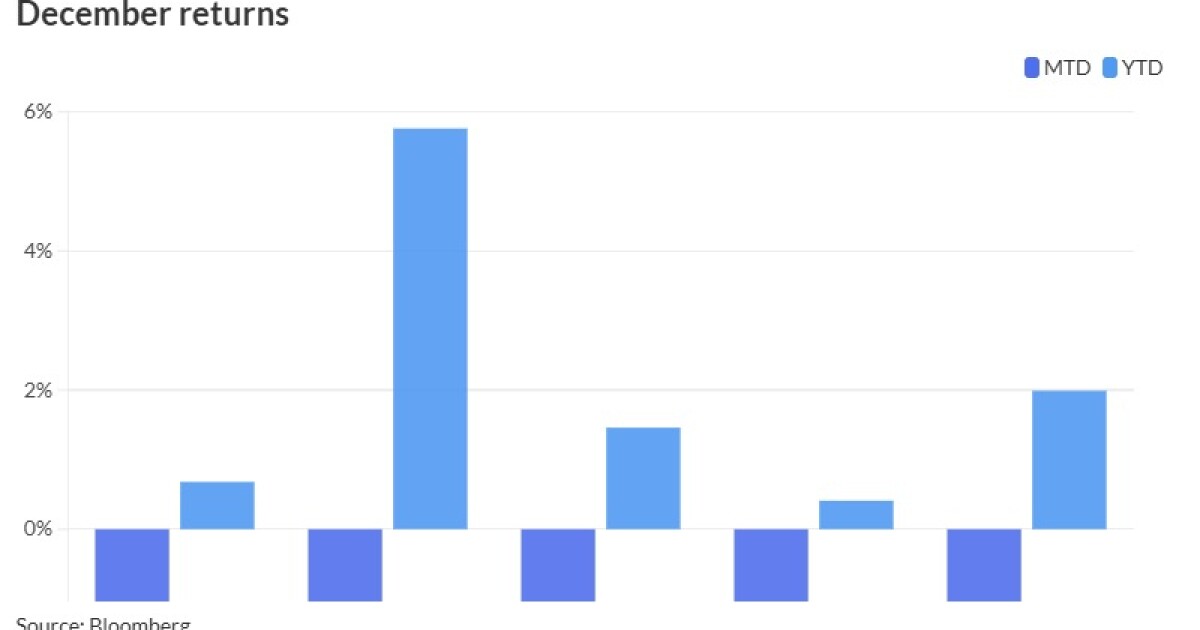
Municipals are seeing losses of 1.82% in December, which has dragged down overall gains to just 0.68% for 2024, per the Bloomberg Municipal Index. High-yield has seen higher losses of 2.18% in December, bringing year-to-date gains to 5.76%. Taxable municipals have fared the worst this month, with losses of 2.56%, moving 2024 gains to 1.46%.
The short index is still in the black at 0.09% in December, with 2.99% returns in 2024.
“The muni market remains under a good deal of pressure,” said Mikhail Foux, managing director and head of municipal strategy and research at Barclays. “Rates have continued selling off, with yields up another 15 basis points, nearing their six-month highs.
“In the past two years we have always seen yield buyers emerge when Treasury yields have reached the 4.5-5% range,” he said. “Typically, tax-exempts underperform during drastic rate selloffs, but it has not been the case this time around — municipal ratios have noticeably increased, especially in the long end, where they were quite rich to start with.”
The two-year municipal to UST ratio Friday was at 65%, the five-year at 65%, the 10-year at 68% and the 30-year at 83%, according to Municipal Market Data’s 3 p.m. EST read. ICE Data Services had the two-year at 67%, the five-year at 66%, the 10-year at 69% and the 30-year at 84% at 4 p.m.
Following the $857.1 million that
“Some portion of these late year outflows is likely the result of the recent back-off in UST rates and additional tax-related trading thereof,” DeGroot said.
Year-to-date inflows are now tracking “modestly lower, at +$41.4 billion (+$27.6bn open-end funds/+$13.8bn ETFs), concentrated in terms of duration (+$38.7bn long term) but somewhat more distributed in terms of credit quality (+$25.4bn IG /+$16.0bn HY),” DeGroot said.
He added that it is worth noting HY municipal funds have attracted 13% of their aggregate assets under management from the beginning of the year, “compared to just 4% for IG fund inflows relative to their AUM at the year’s start.”
The market sentiment overall “seems quite poor at the moment, as we continue to see investors trimming their exposure this late in the year, with bid-wanted activity picking up,” Foux said. “With the current rate sell-off, investors have an opportunity to harvest their losses, and they would be quite valuable this year, as the equity market had yet another big year, and investors are sitting on large capital gains.”
Foux noted that dealers have also started de-risking, which has been customary for them in November-December.
“We have been expecting a relatively difficult January, which was to come on the back of a solid December,” Foux said. “However, it seems that the market sell-off has started earlier than we thought — to us current high-grade levels present a pretty decent entry point for tax-exempts, as January’s cash might help stabilize the market, and we would not be against adding some exposure at current levels.”
There are no sizeable deals on the calendar until the New Year and Bond Buyer 30-day visible supply sits at just $2.4 billion.
AAA scales
MMD’s scale was firmer by two basis points out longer: The one-year was at 2.86% (inch) and 2.80% (unch) in two years. The five-year was at 2.87% (unch), the 10-year at 3.08% (unch) and the 30-year at 3.92% (-2) at 3 p.m.
The ICE AAA yield curve was bumped three to seven basis points: 2.92% (-7) in 2025 and 2.85% (-6) in 2026. The five-year was at 2.87% (-4), the 10-year was at 3.07% (-4) and the 30-year was at 3.88% (-3) at 4 p.m.
The S&P Global Market Intelligence municipal curve was slightly better out long: The one-year was at 2.88% (unch) in 2025 and 2.81% (unch) in 2026. The five-year was at 2.87% (unch), the 10-year was at 3.09% (unch) and the 30-year yield was at 3.87% (-2) at 4 p.m.
Bloomberg BVAL was little changed: 2.95% (unch) in 2025 and 2.80% (unch) in 2026. The five-year at 2.88% (unch), the 10-year at 3.12% (unch) and the 30-year at 3.83% (unch) at 4 p.m.
Treasuries were better across the curve.
The two-year UST was yielding 4.320% (-2), the three-year was at 4.382% (-2), the five-year at 4.382% (-5), the 10-year at 4.528% (-4), the 20-year at 4.805% (-3) and the 30-year at 4.718% (-2) at the close.


